IT Teams are Drowning in Data
Data produced by today’s highspeed networks continues to grow, exacerbating the challenge for IT teams tasked with analyzing massive amounts of data to understand service delivery.
Teams are increasingly reliant on meta data summarizations and KPIs to identify problems, which can result in staff chasing red indicators that may not reflect an actual business-impacting issue. In parallel with this data deluge is a changing skill set landscape in IT, with fewer experts on staff for deep data forensic analysis.
Get the Vision
VIAVI Observer solves these challenges with simple visualizations that help any level of IT to understand performance impact on end user experience.
Through machine learning and automated analysis, Observer pinpoints issues impacting end users with graphical tools that enable IT to pinpoint the root cause of issues fast.
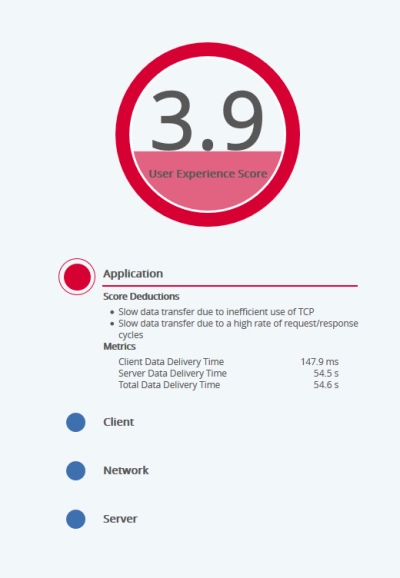
End User Experience Scoring
Using VIAVI patent-pending machine-learning technology, Observer displays a single numeric score reflecting the severity of user impact. No more chasing red KPIs that may not actually be impacting end users. The End-User Experience Score provides automated problem domain isolation, simple problem explanations and easy access to high-fidelity forensics for fast root-cause resolution.
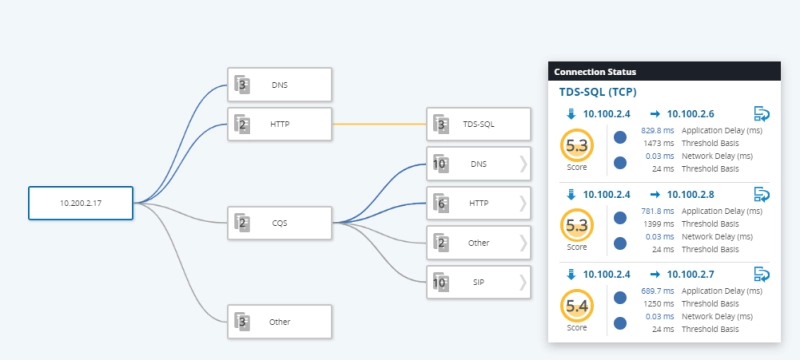
On-Demand Application Dependency Mapping
The Observer On-Demand Application Depending Mapping feature allows the display of connections between systems with a visual map of the network. This facilitates mapping of multi-tier applications dependencies with direct correlation to End-User Experiences Scores that enables efficient troubleshooting.
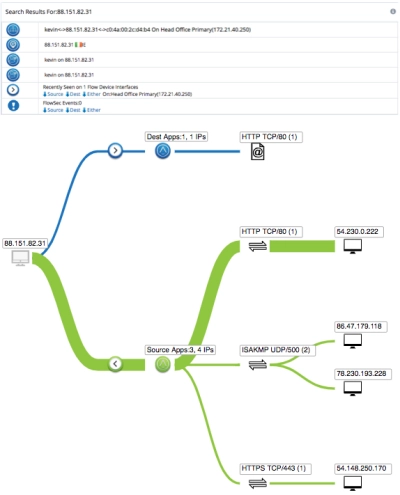
Conversation Path Views
Observer reimagines traditional flow to deliver its full potential. By intelligently stitching together multiple sources of data into an enriched flow record IT teams can leverage accessible, expandable visualizations that lets users hover and sweep into User to IP to MAC relationships, usage patterns and more. Observer enables IT to understand: What’s connected to the network? Who’s communicating across the network?
Recursos
-
Folhetos
Pontuação da experiência do usuário final (End-User Experience, EUE) (pt) -
Artigos técnicos e livros
End-User Experience Scoring -
Video Gallery
Video Series: 5 Common User Complaints. -
Artigos técnicos e livros
Top Strategic Technology Trends for 2024: Continuous Threat Exposure Management - A Gartner Report


