
Apex is the first performance monitoring solution to generate an end-user experience (EUE) score on every transaction. Apex offers adaptability and visibility via multiple data sources: packets, metadata, and enriched flow.
Apex provides global IT service health and status awareness. When service anomalies do arise or potential security breaches are detected, efficient workflows empower NetOps, DevOps, and SecOps groups to uncover root cause and fix it, fast.
Check out real-world troubleshooting workflows of Observer in action with these demos
Apex Features and Benefits Summary
- Machine learning-powered automated EUE scoring converts multiple KPIs into a single easy-to-understand metric combined with detailed score deductions that automatically isolate the problem domain(s) and provide the information needed to prioritize issue remediation.
- Flexible data source options via GigaStor and GigaFlow: packets, metadata, and enriched flow offer the right view for every stakeholder from network engineer to line of business owner
- Customizable dashboards for global operational intelligence with efficient workflows enable fast problem identification and resolution for NetOps, SecOps, and DevOps
- On-demand application dependency mapping enables immediate multi-tier application visibility with no configuration required
- Integrated performance management and forensics for fast service anomaly and rapid cybersecurity breach response
- Flexible deployment options from purpose-built appliances for the data center to Amazon Machine Images (AMI) for simple, efficient cloud deployments
- Deep Packet Inspection (DPI) capabilities address the challenge of understanding network traffic composition and determining if non-critical traffic is negatively impacting key business services and end-users.
- Monitors SSL/TLS handshakes as it analyzes network traffic, identifies digital certificates that have expired or are due to expire and highlights outdated protocols, helping to ensure uninterrupted service for users.
- Efficiently guides UC experts from global summaries and site-specific views to interactive call details. Seamlessly combines packet and flow data to visualize a single point-to-point or complex multipoint call’s path through the network infrastructure.

User-Defined Dashboard F.A.Q.
What is a Network Performance Dashboard?
A network performance dashboard is a report populated with widgets, and these widgets show the information collected by your data sources.
Your reports—your dashboards—are populated with one or many widgets. The data shown by widgets in your dashboards belongs to Observer. To make use of dashboards, Observer must be collecting network trending data and be a data source to Apex. Without trending data, Apex will not have any data for the widgets in a dashboard.

Dashboards that are pre-made by VIAVI are available to you as system dashboards. System dashboards are identical in function to dashboards you create on your own, but they cannot be modified. Additionally, system dashboards provide broad information and are useful for high-level analytics. A temporary filter can be used while viewing system dashboards, but a permanent filter cannot be added.
Any dashboard can have an always-on filter written into its properties. Dashboard filters force every widget in a dashboard to display only information that meets the filter. For example, you can filter a dashboard so that its widgets show statistics from a specific subnet only. Or you can filter a dashboard to search for a telephone number used in a VoIP conversation.
A dashboard filter can be applied to the design of the dashboard itself (always-filtered), applied during viewing of the dashboard (temporary), or applied as a combination of the two.
Each newly created dashboard is considered a user dashboard. User dashboards are unique to the user that logged in to Apex and created it, and it can only be viewed and modified by that user. To share a user dashboard with other Apex users, the creator must promote the dashboard. A promoted dashboard becomes a site dashboard that is viewable by other users. A promoted dashboard cannot be demoted.
This means you can promote a user dashboard to a site dashboard without promoting the underlying user widgets—if any exist. This protects your personal user widgets from being altered and changed by others. If you want to share a dashboard with others (by promotion) and also allow changes to those widgets, the widgets must be promoted to site widgets.
As long as you are viewing a site or system dashboard—user dashboards are not applicable—your current view of the dashboard can be summarized into a shareable URL. Whoever clicks the URL you share can see the dashboard how it appeared to you. Choices you have made like the reporting period and any temporary dashboard filters are retained by the URL. You can use this sharing feature in your instant messages, emails, or other documents.

Additional resources:
-
Apex Available as an Amazon Machine Image (AMI)
Apex can now be procured on the Amazon Marketplace website as an AMI for simple, efficient cloud deployment.
-
Certificate Management
Automated analysis designed to prevent SSL/TLS certificate expirations and insecure sessions from going unnoticed. Provides security and network engineers with real-time analysis, reporting, and notifications, keeping teams one step ahead of certificate expirations. Allows for easy identification of servers publishing insecure sessions. Enables teams to swiftly retire outdated or insecure protocols, improving the overall security posture. Identifying and remediating certificate-related issues, helps to prevent potential outages and ensure a seamless user experience.
-
Unified Communications (UC)
Purpose-built dashboards combined with highly efficient workflows provide actionable insights for global, site-specific, and single-call UC visibility. Interactive Call Details visualizations show the paths calls take through the network infrastructure, pinpointing exactly where and why quality degradation occurs. One-click access to relevant packet data is also provided, ensuring VoIP and UC experts have all the information they need to monitor call quality and perform efficient troubleshooting.
-
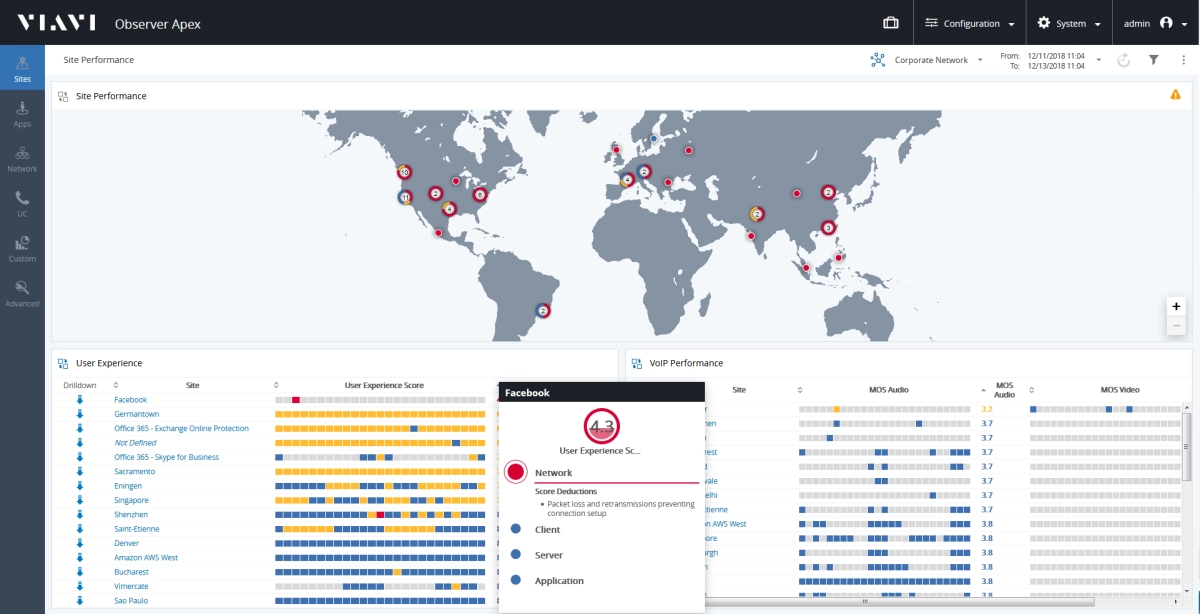
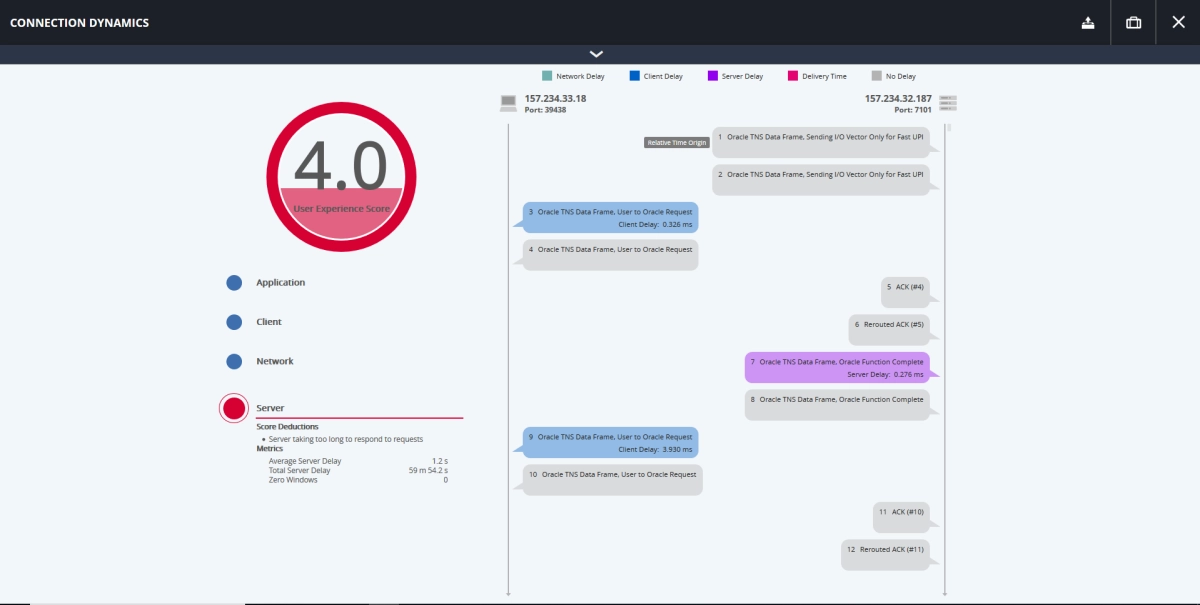
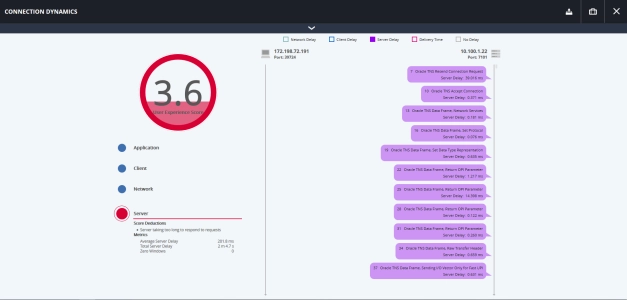
End-User Experience Scoring
Machine learning powered end-user experience (EUE) scoring for every every transaction with intelligently rolled-up values at the dashboard site level. Scores are color-coded and range from 0 to 10 with the corresponding problem domain highlighted. EUE scorecards show a clear display of the overall score, along with the individual scores for the contributing domains: Network, Client, Server, and Application. For EUE values with score deductions across multiple domains, you can easily identify and prioritize the issues that matter most. When a single domain contains multiple score deductions, each issue is listed along with its corresponding deduction, making it clear what is contributing the most to performance degradations.
-
Custom Dashboards and Streamlined Workflows
Customizable dashboards provide network observability of IT service health at the regional, country, city, data center levels, or functional level. When combined with end user experience scoring, IT teams can gain instant world-wide situational awareness of all resources and then, when required quickly drill down to an individual user for rapid problem resolution. Receive complimentary dashboard assistance by contacting VIAVI here by a technical specialist. Be sure to enter “Complimentary Dashboards” in the comments box.

-
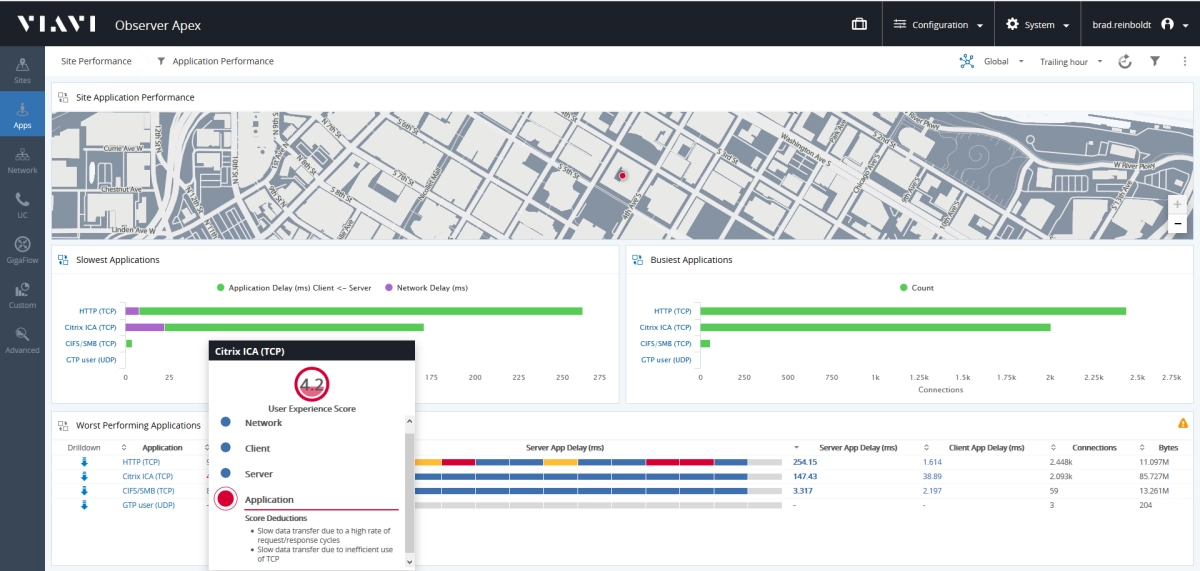
On-Demand Multi-Tier Application Intelligence
On-demand application dependency mapping offers fast discovery of app interdependencies. Maps are built automatically to display complex relationships with simple clarity. This allows users to determine worst connections, app tiers, and network delay threshold deviations, while sorting all connections by status; critical, marginal, and acceptable.
-
Intuitive Visualizations with IP Viewer
By compiling Layer 2 to Layer 3 insights into a single enriched flow record, Observer can produce unique, interactive visualizations that illustrate the relationships between User, IP, MAC, and application usage in the network. A NetOps or SecOps user can simply enter a name enter in a username and immediately find all devices, interfaces, and applications associated with it. Finding out what is connected and who is communicating across your network has never been easier.
-
Advanced Deep Packet Inspection (DPI)
Gaining in-depth insights into network traffic can be challenging. The added visibility provided by DPI allows network engineers to easily identify traffic running on non-standard ports, recognize and classify various traffic types, and take a deeper look into protocols like HTTP and HTTPS.
DPI capabilities provide answers to commonly asked questions:
- What is this unidentified traffic and what application, or service is it associated with?
- What is all this HTTP/HTTPS traffic – Is it traffic I want on my network?
- Is non-business traffic causing congestion and impacting performance?


Observer Apex collects and aggregates data from Observer GigaStor, Observer GigaStor M, Observer GigaFlow to achieve enterprise-wide network observability and security visibility for NetOps and SecOps teams. By intelligently combining packet information, metadata, and enriched flow records, Apex delivers centralized management of end-user experience scoring, performance, and cybersecurity intelligence.

Select an Observer Apex form-factor that best aligns with your IT monitoring requirements and deployment best practices. Then scale as required to grow with your business. Based on the number of data sources, Apex is offered in three tiers to be monitored:
- Tier 1 – Apex Standard - available in a cloud version (as an AWS AMI) and a software edition
- Tier 2 – Apex Workgroup - form-factors include hardware, cloud version (as an AWS AMI) and a software edition
- Tier 3 – Apex Enterprise - Hardware appliance only
-
ObserverONE
Observer ONE is an all-in-one VIAVI solution that provides both performance visibility and optional security investigation capabilities across the Observer platform. This appliance combines Observer Apex End-User Experience Scoring GigaStor packet capture, and GigaFlow enriched flow analysis in a single platform, delivering powerful network observability with a compact footprint and cost-effective deployment.
ObserverONE is now available in two configurations:
Standard
All-in-one platform for network performance monitoring.Security
All-in-one platform with built-in Observer Threat Forensics threat detection and investigation capabilities.

视频
Video Gallery
产品说明
手册
- Enriched Flow with Observer
- Extending Performance Visibility into Amazon Web Services (AWS)
- Extending Visibility into Microsoft Azure – Leveraging VNet flow logs in Observer
- Forensics Meets Finance: A Strategic Response to EU Compliance Requirements
- Observer Apex (简体中文)
- Observer GigaFlow
- Observer GigaStor and GigaStor M
- ObserverONE
- See More, Do More. Optimizing Healthcare Network Performance and Security
- The Need for Effective Digital Certificate Analysis
- Unified Communications
- 最终用户体验评分 (简体中文)
案例研究
海报
白皮书和书籍
- 2025/26 State of the Network Executive Summary
- 2025/26 State of the Network Study
- Comprehensive and Actionable Enterprise Performance Management
- EMA Radar Report: Network Performance Management 2021
- From Zero-to-Insight in Three Days or Less
- How a NetOps/SecOps Alliance Can Outmaneuver the Enemy: Winning the Security Battle
- How to Optimize End-User Experience in a Cloud-Enabled Landscape
- How to Solve Six of the Biggest IT Challenges in 2021
- Navigating NIS2 and DORA Compliance: Why High-Fidelity Forensic Data is the Key to Success
- NetFlow vs Packet Data
- Network Monitoring Technology
- Network Observability Enables Modern Infrastructure: Capacity Planning
- NPMD for Network Security Forensics
- Using Wire Data for Security Forensics
-
Observer Services
Whether it's a quick initial setup or a comprehensive on-site implementation and configuration, Observer Platform Consulting options are designed to ensure that you get the most out of your Performance Management Solutions.