End-User Experience Monitoring

Network Performance Monitoring from the End-User’s Perspective

Understanding the user experience is the key to optimized application performance and issue resolution. End-user experience monitoring solutions from VIAVI utilize powerful machine learning to deliver real-time insights through a single, intuitive score.

EUE Monitoring from VIAVI

Monitoring, troubleshooting, and complaint resolution activities stretch IT teams to their limits. Accelerating trends towards remote working and SaaS cloud migration only add to this burden. It is no longer feasible to assess network health by reviewing endless lists of KPIs with no clear focus or direction. End user satisfaction is the target driving effective metric prioritization and weighting.

End-user experience monitoring tools from VIAVI analyze passive and active data sources to produce a simplified yet intelligent score. Issues are quickly isolated to the network, application, sever, or client domain to enable more proactive and efficient IT support. Intuitive and accessible visualizations and dashboards make it easy to interpret end to end network performance.

What is End-User Experience Monitoring?

EUE monitoring is used to measure and prioritize network data based on the quality of experience delivered to users. Rather than relying on direct client feedback to identify disruptions, delays, or application performance problems, end-user experience monitoring leverages improved visibility and analysis of performance indicators to proactively detect regressions.

  • End-user experience scoring is used to quantify performance on a numeric scale and establish response thresholds. Scores are weighted depending on the underlying algorithm and relative importance of contributing factors. Aggregate end-user experience scores assess site or geolocation performance while an individual EUE score characterizes the experience of a discrete user.
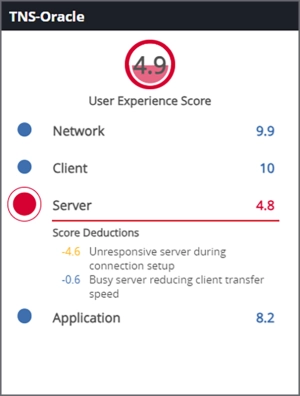
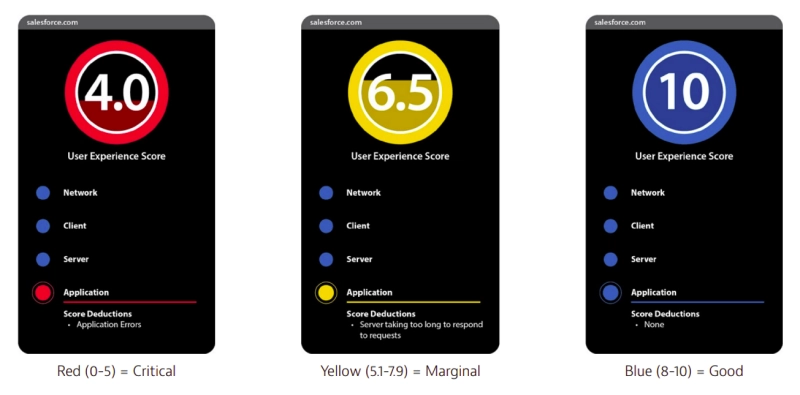
  • Patented VIAVI EUE scoring is derived from 30+ key performance indicators (KPIs) distilled by the Observer Apex platform into simple color-coded scores ranging from 1-10. Machine learning is used to characterize unique environmental and application factors for each network conversation to make the scoring more dynamic and impactful.
  • Executive dashboards are a common feature of end-user experience monitoring software. These dashboards are typically customizable and include intuitive lists of sites and applications for which EUE data is available. Drilling down within the dashboard allows operators to uncover interactions and dependencies that point to the root cause of low EUE scores. 
End-User Experience Monitori

Why is End-User Experience Monitoring Important? 

As SaaS has evolved and more business-critical applications migrate to the cloud, establishing adequate levels of observability throughout the network becomes more challenging. At the same time, the shift to remote working makes it difficult to pinpoint the scope and root cause of performance issues. By focusing on end user satisfaction as the ultimate barometer of network health, end-user monitoring practices help to narrow the visibility gap while proactively assuring Quality of Service (QoS).

  • “IT overload” is a term used to describe the growing problem of Tier 1 support teams overwhelmed by tickets with no clear path to resolution. End-user experience scoring and dashboards reveal the scope, impact, and domain of network issues easily so that they can be corrected or routed efficiently. This proactive approach also allows more problems to be detected and prevented before any users are impacted.
  • Issue prioritization helps to ease the burden on IT teams. Color-coded EUE scores highlight the most impactful performance issues. Dependency mapping and domain breakouts for low-scoring applications then point to the interactions at the root of the problem so that troubleshooting priorities can be set. This improves IT efficiency and cost performance by accelerating mean time to repair (MTTR). 
    On-Demand Multi-Tier Application Intelligence
  • IT skills gaps become more prevalent as network complexity moves beyond the understanding of less experienced IT professionals. Rather than burdening IT teams with hundreds of KPIs with no correlation to user impact, end-user experience monitoring tools produce a single, intuitive KPI that is easily accessible to all skill levels and lessens the need for and impact on seasoned and experienced IT experts.

EUE Monitoring Use Cases

Ensuring the quality of the end-user experience has become a top priority for IT teams in a wide range of industries. The use cases benefiting from robust end user application monitoring continue to expand as network and user locations diversify.

  • Financial Services: As financial services have dispersed via the cloud and mobile banking apps are the standard, customers have come to rely on secure, low latency transactions and efficient data transfers. End-user experience monitoring quickly identifies sites, users, or applications that are experiencing slowdowns or outages and provides the tools needed to support performance baselining and threat hunting activities.
  • Healthcare Organizations: IT teams must secure sensitive patient information while providing seamless 24/7 network availability. End-user experience management supports these priorities by preventing performance issues before patients or providers are impacted and providing unmatched access to forensic data to mitigate security incidents.
  • Manufacturing: Downtime in a manufacturing environment equates to lost productivity, revenue and is a competitive disadvantage. When network delays or outages do occur, it is important to know exactly who is impacted, and how. EUE scoring is a valuable tool for determining the root cause of issues quickly to minimize the impact on production.
  • Network Capacity Planning: Network utilization and traffic must be reviewed continually to determine when upgrades are needed. Insightful capacity planning should also consider the performance of existing services from the user perspective. The EUE monitoring and capacity planning dashboards of the Observer Apex platform capture over-capacity symptoms such as jitter that can degrade the quality of services like VoIP and video streaming.
  • Remote Working: Today’s networks were not intended to have most users outside the network perimeter, but this is quickly becoming the norm. End to end-user monitoring increases observability into conversation paths between remote users and the centralized network, maps application dependencies, and ensures home-based workers remain productive.  
  • VPN Monitoring: As a byproduct of remote working, virtual private network (VPN) usage is increasing at an unprecedented rate. With VPN oversubscription becoming a leading cause of network disruption for remote employees, the monitoring of VPN traffic has gained importance. EUE monitoring allows operators to gain deeper insight into VPN tunnel performance along with the quality of delivered applications. 

Important End-User Experience Monitoring Metrics

The volume and diversity of data available to IT teams has enabled higher levels of visibility than were previously possible. On an individual basis, these metrics can be overwhelming to review and analyze. By collecting and intelligently weighting the most critical metrics from the end user perspective, VIAVI end-user monitoring software distills this data into an actionable and intuitive format.

KPI Active Test
  • Flow records capture important interface information and network conversation elements including IP addresses and protocol data, timestamps, and device IDs to provide details on traffic and usage trends. VIAVI enriched-flow records combine flow data from multiple sources to establish relationships between the user, IP, MAC, and application usage.
    Enriched Flow Diagram/
     
  • Packet Data also contains important user, device, and source IDs along with in-depth browser, application, and VoIP information from the packet payload. Performance indicators such as jitter, loss, and retransmissions can be measured based on the behavior and content of the packets. The VIAVI GigaStor packet capture, analysis, and storage appliance features industry-leading line-rate capture, data storage, and forensic analysis capabilities.
  • Active Monitoring uses simulated user behavior and automated test scripts to strategically monitor third party performance in real time. Since active monitoring practices are not bound to actual traffic and usage patterns, synthetic traffic can be tailored to cover a wide range of use cases and conditions that eliminate end user application monitoring blind spots.

How to Monitor Application Performance from a User Perspective

End-user experience monitoring tools from VIAVI make it easy to navigate from a high-level executive dashboard to the root cause of issues jeopardizing end user satisfaction. In a few steps, detailed user, scope, and traffic flow insights for a myriad of network and application issues can be accessed. 

  • Review Scores: The dashboard visually displays which applications, tiers, and sites are performing poorly based on end-user monitoring. Color coding indicates problem areas.
  • Review Performance Details: Clicking on any end-user experience score brings up a domain scorecard with a breakdown of network, client, server, and application performance. Details on what led to any score deductions are also provided.
  • Drill Down to Errors: Once the nature of the problem is identified on the scorecard, auto-generated dependency maps and active test details illustrate the source and timing of the issue in greater detail. Backend servers with degraded performance are easily identified.
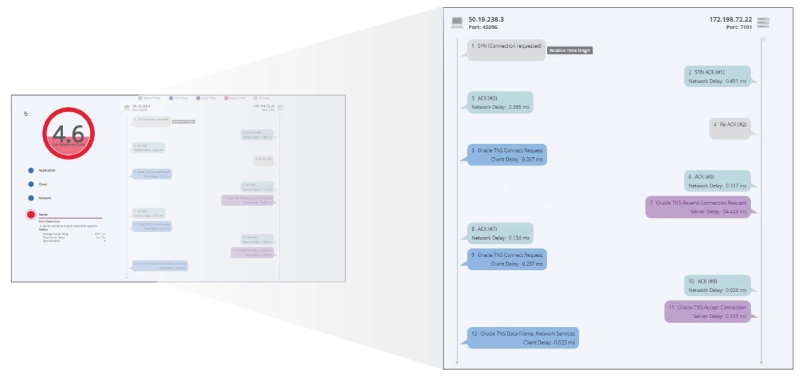
  • Connection Dynamics: Individual network conversations and their associated user experience scores can be reviewed by selecting “connection dynamics” from the drill down arrow for any network link. This graphical review of transactions uncovers areas of concern and points directly to root cause.
  • Packet Capture: Traffic forensics, GigaFlow analysis, and trace extraction can also be selected from the drill down arrow. When packet data is desired for in depth analysis, unabridged PCAP files are exported and stored with a single click.
    EUE Connection

How End-User Experience Monitoring Can Be Improved

Traditional methods of end-user experience scoring require all KPIs to be aggregated into a terminal window, which can be difficult and time consuming. Using one (or few) data sources or attempting to leverage hundreds of metrics independently are common historical strategies for evaluating experience. Neither approach supports efficient monitoring or accurate root cause analysis.

  • VIAVI end-user experience monitoring software uses adaptive machine learning to run dozens of KPI inputs through multiple algorithms, resulting in one intuitive and meaningful score. This eliminates the noise and false positives that can lessen the value of traditional experience scoring methods.
  • New scoring innovations continue to evolve as synthetic testing and analysis methods improve. Artificial intelligence and machine learning, while still in their infancy, are the ideal catalysts for proactive end-user experience management. 

End-User Experience Scoring

The single numeric score generated by Observer Apex is derived from multiple KPIs along with Layer 4 data that helps to assess transport protocol behavior and isolate the problem domain. This comprehensive data capture and analysis leads to accurate end-user experience scoring results.

  • Scores ranging from 1-10 can reflect a single user’s experience or a group of users defined by site, geolocation, etc.
  • IT teams can quickly address 'red scores' as the most urgent issues, followed by yellow scores to proactively drill down to issues before users are impacted. 
  • Scores are calculated in real-time and retained over extended periods to assure both short and long-term end user satisfaction.
    End-User Experience

End-User Experience Monitoring Tools 

By focusing on end user satisfaction and customer collaboration, VIAVI has defined the performance metrics that matter most. Industry-leading network performance monitoring solutions have converted this expertise and insight into unprecedented visibility and optimized service delivery. 

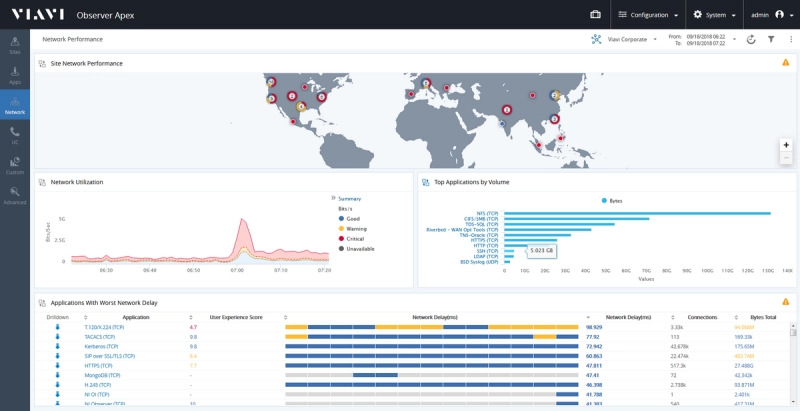
  • Observer Apex is the first network performance monitoring solution to generate an end-user experience score for every transaction. By integrating packet, flow, and active test data, Apex provides the industry’s most comprehensive end to end-user experience monitoring. Intuitive dashboards are easily customizable to address specific business and IT priorities. Observer network forensics support deep dive investigations with high fidelity data sources.
    Observer Apex

Highly recommend using Observer in any environment for complete Application and Network Performance Monitoring. End User Experience (EUE) calculations in addition to simple right-click On-Demand ADM, Connection Dynamics and Trace Extraction all help to make it effortless in determining RCA. (Read Full Review)

Network Engineer III
$3B Healthcare Industry

Mehr erfahren

Wir helfen Ihnen gern

Bitte wenden Sie sich an uns, wenn Sie mehr Informationen benötigen, ein Preisangebot wünschen oder Videos mit Produktvorführungen sehen möchten. Wir sind dafür da, Ihnen zu helfen.