Monitoreo de experiencia de usuario final
La plataforma Observer proporciona puntuaciones intuitivas y minuciosas desde la perspectiva del usuario final.
Monitoreo de la experiencia del usuario final de la mano de VIAVI
Las actividades de monitoreo, solución de problemas y resolución de quejas llevan a los equipos de TI al límite. Además, el trabajo en remoto y la migración a la nube se suman a esta carga. Ya no es factible evaluar el estado de la red revisando listas interminables de indicadores clave del desempeño sin un enfoque o sentido claros. La prioridad está en contar con un método sencillo y eficaz para monitorear la experiencia del usuario final que evalúe la experiencia real de uso de nuestros usuarios finales. La solución de monitoreo de la experiencia del usuario final de VIAVI interpreta automáticamente grandes cantidades de datos de paquetes complejos, y genera una puntuación sencilla y procesable por medio de nuestro algoritmo patentado. Los resultados se proporcionan por medio de flujos de trabajo intuitivos con paneles ya configurados y personalizables. Los problemas se pueden aislar rápidamente en los dominios de red, aplicación, servidor o cliente. Además, se incluyen deducciones detalladas de las puntuaciones que permiten priorizar los problemas y resolverlos de manera eficaz.
Métricas importantes para el monitoreo de la experiencia del usuario final
El volumen y la diversidad de datos disponibles para los equipos de TI proporcionan un análisis más profundo de lo que antes era posible. En lugar de simplemente recopilar y presentar una recopilación apabullante de resultados, la puntuación automatizada, la priorización y el aislamiento de dominios proporcionan al personal de TI la información básica procesable que se necesita para mejorar o restaurar la experiencia de los usuarios finales.

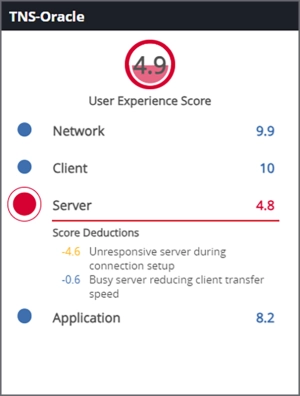
El aislamiento de los dominios de la experiencia del usuario final y las deducciones detalladas de las puntuaciones automatizan la identificación y la priorización de los problemas
Cómo superar los desafíos de monitoreo de redes
El análisis en tiempo real de la red es primordial para abordar los problemas de desempeño y seguridad. A medida que la adopción de la red, el IoT y las diversas herramientas de monitoreo amplían las fuentes de datos, centrarse en la experiencia del usuario final (EUE) ayuda a superar estos desafíos habituales:
- Sobrecarga de indicadores clave del desempeño: demasiadas métricas pueden crear confusión y retrasar la resolución. Las puntuaciones de la EUE simplifican los datos al extraer información clave y convertirla en un valor único centrado en el usuario, lo que mejora la priorización y reduce el tiempo medio de identificación (MTTI).
- Equipos aislados: la infraestructura de la nube a menudo limita la visibilidad y complica la colaboración. Las puntuaciones de la EUE salvan las distancias funcionales y permiten a los equipos de NetOps y SecOps, entre otros, aislar problemas y asignar rápidamente al equipo adecuado para responder.
- Limitaciones de recursos: una cantidad mayor de datos puede sobrepasar a los ingenieros de la capa 3, lo que supondría el retraso de proyectos críticos. El monitoreo del EUE proporciona a los equipos de las capas 1 y 2 herramientas intuitivas para visualizar dominios de problemas, lo que reduce el tiempo para su resolución y permite que los recursos se dediquen a la innovación.
Desempeño de las aplicaciones desde la perspectiva del usuario
Las herramientas de monitoreo de la experiencia del usuario final de VIAVI facilitan la navegación desde un panel de resumen global de alto nivel hasta la causa raíz de los problemas para mejorar el grado de satisfacción del usuario final en solo unos pasos:
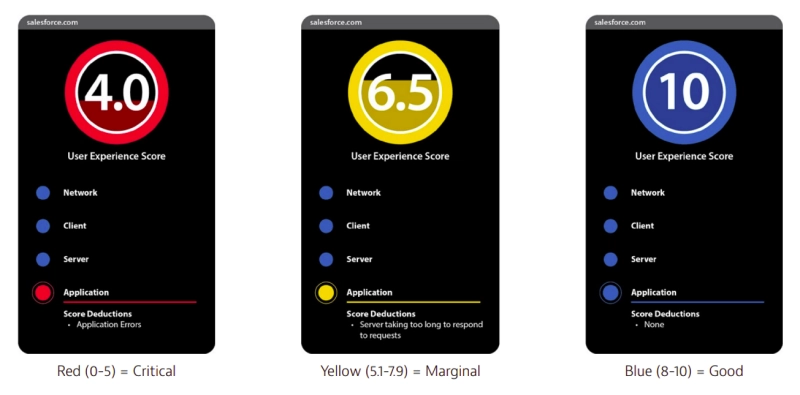
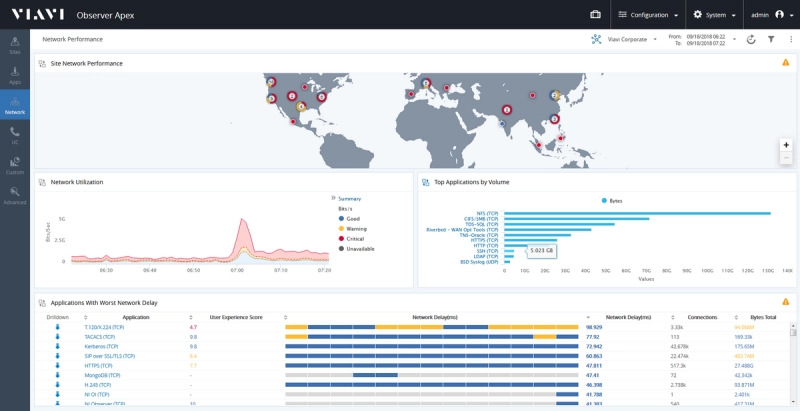
- Revisión de las puntuaciones: el panel muestra visualmente qué aplicaciones, capas e instalaciones están proporcionando un desempeño deficiente en base al monitoreo de los usuarios finales. La codificación por colores resalta las áreas problemáticas.
- Revisión de los datos de desempeño: al hacer clic en cualquier puntuación de la experiencia del usuario final, se muestran puntuaciones desglosadas para el desempeño de la red, el cliente, el servidor y las aplicaciones, así como un desglose preciso de las deducciones de las puntuaciones.
- Mapas de dependencias de aplicaciones bajo demanda: una vez que se identifica la naturaleza del problema en las puntuaciones, una serie de mapas de dependencias generados automáticamente ilustran el origen del problema de forma más detallada.
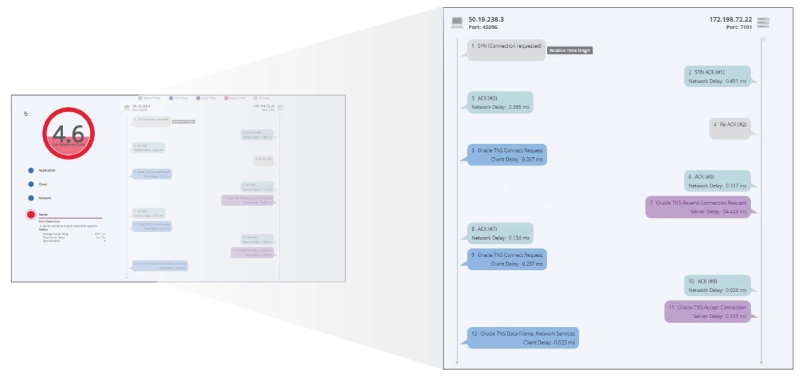
- Dinámica de conexiones: las conversaciones de red individuales se pueden visualizar en un sencillo diagrama escalonado que incluye solicitudes, respuestas y los tiempos correspondientes. Cuando se combinan con las puntuaciones de la EUE y el aislamiento de dominios, esta vista de gran utilidad facilita la identificación de las causas raíz sin tener que observar cada paquete.
Captura de paquetes: cuando se requieren datos de paquetes para un análisis detallado, se puede acceder a archivos PCAP íntegros con solo un clic.

La dinámica de conexiones combinada con las puntuaciones de la EUE automatiza la solución de problemas en el nivel de las conversaciones
Enfoque de VIAVI en cuanto al monitoreo de la experiencia del usuario final
Intentar analizar y relacionar docenas de métricas manualmente ha sido un enfoque habitual para evaluar la experiencia del usuario. Sin embargo, se necesita un enfoque automatizado, mejor y más eficaz.
- Observer de VIAVI saca partido del aprendizaje automático al ejecutar docenas de entradas de indicadores clave del desempeño con diversos algoritmos, de manera que se obtiene una puntuación intuitiva y procesable. Esto elimina el ruido y los falsos positivos que pueden reducir el valor de los métodos de análisis de desempeño tradicionales.
- Observer de VIAVI proporciona visibilidad en la nube. Al proporcionar puntuaciones de la EUE en AWS, se recupera la visibilidad que se pierde a menudo durante las migraciones a la nube, y se garantiza que la propiedad y la responsabilidad de los problemas estén claras.
- A medida que mejoran los métodos de análisis, se siguen produciendo nuevos avances de puntación. Las puntuaciones de la EUE de VIAVI han evolucionado más allá del aislamiento de dominios básicos para proporcionar un desglose detallado de las deducciones de cada puntuación individual, lo que simplifica el proceso de averiguar qué problemas están causando realmente la degradación del desempeño, a fin de darles prioridad con respecto a problemas con consecuencias menores.
Puntuación patentada de la experiencia del usuario final
La puntuación numérica única que genera Observer Apex se calcula a partir del análisis de diversos indicadores clave del desempeño de la red. Este enfoque deriva en resultados procesables de puntuaciones de la experiencia del usuario final y en la capacidad de aislar rápidamente el dominio del problema entre aplicación, servidor, red o cliente.
- Las puntuaciones del 1 al 10 pueden reflejar cuál es el desempeño de una aplicación o servicio, la experiencia de un único usuario, o de un grupo de usuarios categorizados por ubicación, geolocalización, etc.
- Las puntuaciones de color rojo se corresponden con los problemas más urgentes, mientras que las puntuaciones amarillas indican una degradación menos grave (marginal).
- Las puntuaciones se calculan en tiempo real y se conservan durante largos períodos de tiempo para garantizar una satisfacción de alta fidelidad del usuario final, tanto a corto como a largo plazo.

Revolución en el monitoreo de la experiencia del usuario final
VIAVI, al centrarse en la satisfacción del usuario final y la colaboración con el cliente, ha definido las métricas del desempeño más importantes. Las soluciones de monitoreo del desempeño de la red líderes en el sector han convertido esta experiencia y estos conocimientos en una prestación optimizada de los servicios y un nivel de visibilidad sin precedentes.
- Observer Apex es la primera solución de monitoreo del desempeño de la red que genera una puntuación de la experiencia del usuario final para cada transacción. Al integrar diversas fuentes de datos (por ejemplo, de paquetes y de flujo), Apex proporciona el monitoreo de la experiencia del usuario final más exhaustiva y completa del sector. Sus intuitivos paneles se pueden personalizar fácilmente para abordar prioridades específicas de TI y empresariales. Los análisis forenses de red de Observer sirven de apoyo para investigaciones detalladas al aportar fuentes de datos de alta fidelidad.

Documentos técnicos y bibliografía
Vídeo
Seminario en línea
Déjenos ayudarle
Estamos a su disposición para ayudarle a avanzar.


