Network Capacity Planning
The What, the Why, and the How

Network capacity planning is an ongoing process that involves continually assessing network utilization, traffic volumes, and traffic type to identify shortcomings that could cause performance chokepoints affecting the end-user’s experience and to identify when and where upgrades are needed. Capacity planning takes baseline bandwidth utilization and compares it with latest usage trends to determine which sites may require load-balancing or additional bandwidth allocation.
Why is Network Capacity Planning important?
Capacity planning is critical to service availability, reliability, and business continuity. In the VIAVI State of the Network 2021 report, global respondents indicate that bandwidth demand is still growing and expected IT budget growth has nearly doubled since last year. Results suggest that IT teams are likely to implement enhancements to the network that could add more network traffic volume or change how traffic traverses the network. The report also shows that more than 80% of respondents will invest in upgrading to 400Gb by 2023 adding further strain and bottlenecks to existing architectures. The need to have visibility into bandwidth allocation is critical to ensure that IT teams can justify enhancements or implementing higher speed networks.
The more traffic on the network, the more congested sites become, impacting user-experience. This is especially true with services such as VoIP or streaming applications: network delay and jitter due to increased network traffic can make some services unusable. Appropriate capacity planning requires a delicate balance of resource and budget allocation to optimize utilization and return on investment.
Without proactive and ongoing capacity planning measures, organizations risk decreased employee productivity from degraded network performance, reduced customer satisfaction, Service-Level Agreements not being met, possible brownouts or complete downtime, all of which result ultimately in a poor experience for end-users.
Key Benefits of the VIAVI Observer Platform
Having a solution that supports continuous visual assessment of utilization, volumetric and traffic type distribution can detect emerging bottlenecks before they are an issue, save on troubleshooting time, mitigate impact to users, and support more efficient investments. The Observer Platform is an accurate and easy-to-use solution that satisfies all these requirements with actionable data. Whether the bandwidth issue was identified proactively using the capacity planning dashboards, or by reacting to user complaints, Observer’s intuitive capacity planning reports can act as a business case to approve extra bandwidth spending, return locations to uncongested states, and keep end-users productive.
Device-Based and Site-Based Workflows with Drilldown for Performance Analysis
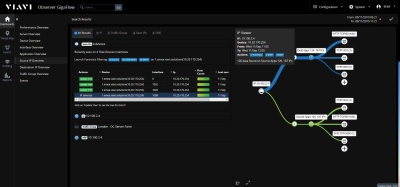
Backed by enriched and enhanced NetFlow, Observer provides usage insights on a per interface basis down to the layer 2 switch, with graphical summaries that illustrate the busiest sites or devices and provides additional detail into the individual WAN links. With each detail view – site or device— IT teams can drill down into the network data for additional analysis and faster troubleshooting by quickly finding the root cause of the chokepoint.

Device- and Site-Based Dashboards Provide Usage and Utilization Insight
Burst Analysis Techniques to Solve Capacity Related Issues
Capacity reports in Observer use a sophisticated burst analysis, logging time spent in each range of utilization: greater than 80% (high), 60-80% (moderate), 30-60% (low), and less than 30% (very low). Using this data, IT teams can easily determine whether utilization at each location is steady, increasing or decreasing over an extended period. This is critically important for the network engineer responsible for monitoring or resolving issues -- he or she can pinpoint exactly when the link started becoming congested. This is particularly valuable when responding to user reported issues and aids rapid troubleshooting.
Using Bandwidth Trends for Proactive Capacity Planning
Network architects can quickly use color as a guide to identify issues using Observer reports: Red indicates interfaces that are in a congested state, how long this has been the case, and where urgent upgrades are needed. The goal is to avoid a red alert state because that indicates users and productivity are being impacted.

Color-Coded Capacity Planning Reports on WAN Spending
Organizations trying to get ahead of capacity challenges, use these reports to easily identify and track bandwidth trends over time. Orange alerts lead them to links that are at 60-80% utilization and that may need action taken. Zooming in helps architects to identify areas of bandwidth growth over an extended time period and closely monitor those sites for utilization patterns and increases. Using this color-coded approach, it’s faster and easier to know what and where to monitor – proactively – and determine which sites need targeted spend in the next budget period. Application summary graphs can also help IT teams discern which application(s) may be responsible for growth.
Related Resources
Products
-

Observer Apex
Gain Comprehensive Cloud-to-On-Premises Service Visibility with End-User Experience Scoring
-

Observer GigaFlow
More than just flow; user, machine, network and, application data – in a single enriched record
-

Observer GigaStor
Enable end-user experience scoring with the best packet capture, analysis, and storage solution in the industry -...