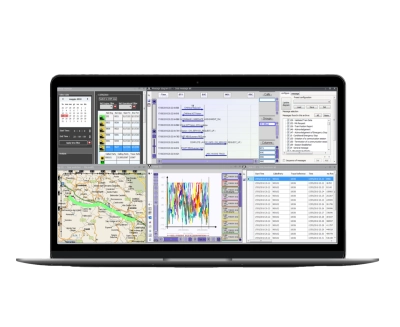
NetProbe Analytics is an interactive analytics and visualization platform that enables operational users to pinpoint the root cause of telecoms and signaling problems in real-time.
The rich set of graphs, reports and schematics, enables users to drill into specific areas to uncover the causes of network quality and signaling problems.
Highlights
- Real-time interactive analysis of GSM-R & the rail telecoms networks and signaling system data
- Pre-built reports, graphs and charts ensure expert operational users have all the tools required
- Map-based graphical views enable data from different sources to be combined and visualized using GPS location information and timestamps
- User-configurable and extensible using the SDK, enabling new reports and graphs to be built easily and quickly on implementation
- Rich client architecture delivers an excellent user experience, coupled with a terminal server infrastructure for ease of client updates
Analyze and report on rail telecoms and signaling systems performance
NetProbe Analytics is a highly powerful software platform that enables different data streams to be collected and viewed at the same time. As a dedicated rail telecoms, radio frequency, signaling & digital interlocking analysis platform, it can simplify and automate time consuming and complex tasks. These include interference and inter-modulation analysis, as well as efficiently pinpointing GSM-R, rail telecoms, signaling and interlocking issues.
NetProbe Analytics can be used to produce a wide variety of custom KPI and management reports. This includes for example: graphical displays, charts, graphs, maps, and reports, which clearly identify current statuses, failed KPIs, trends and other areas needing more investigation.
