ExploreQOS (Discontinued)
Network Performance Analysis
Main features
- Multi-dimensional dashboards: KPIs are calculated over several dimensions giving a detailed view per service (voice, SMS, data and USSD)
- Configure and receive real-time alerts
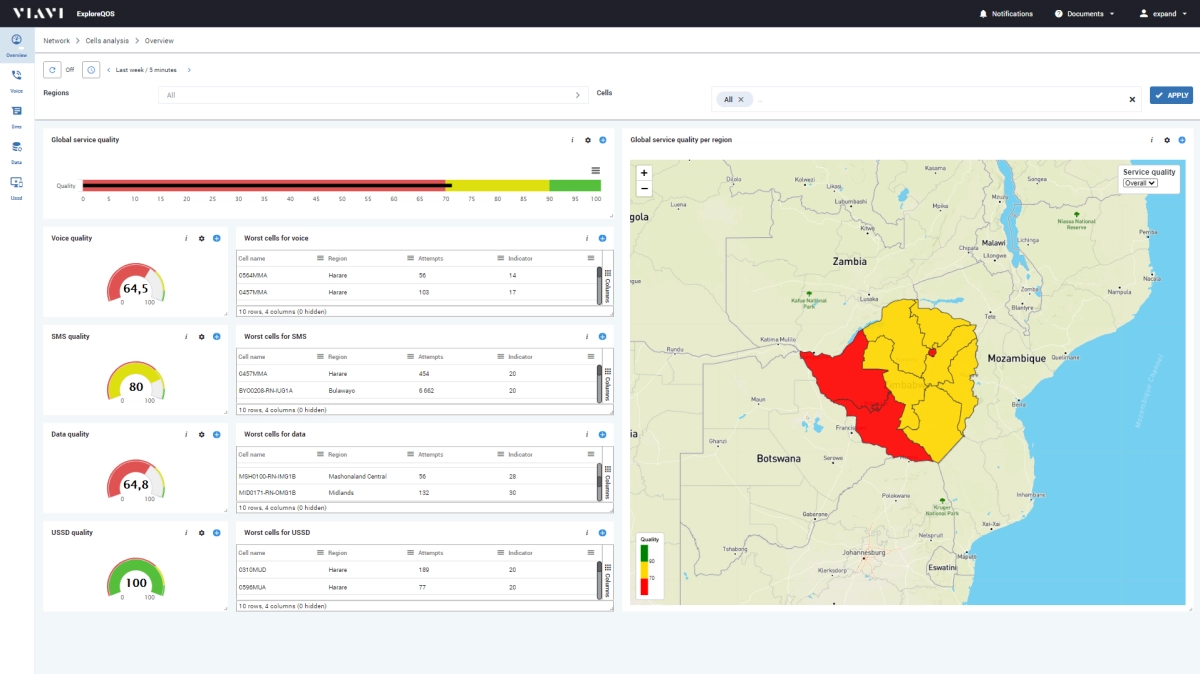
- Map to visualize KPI per region down to cells
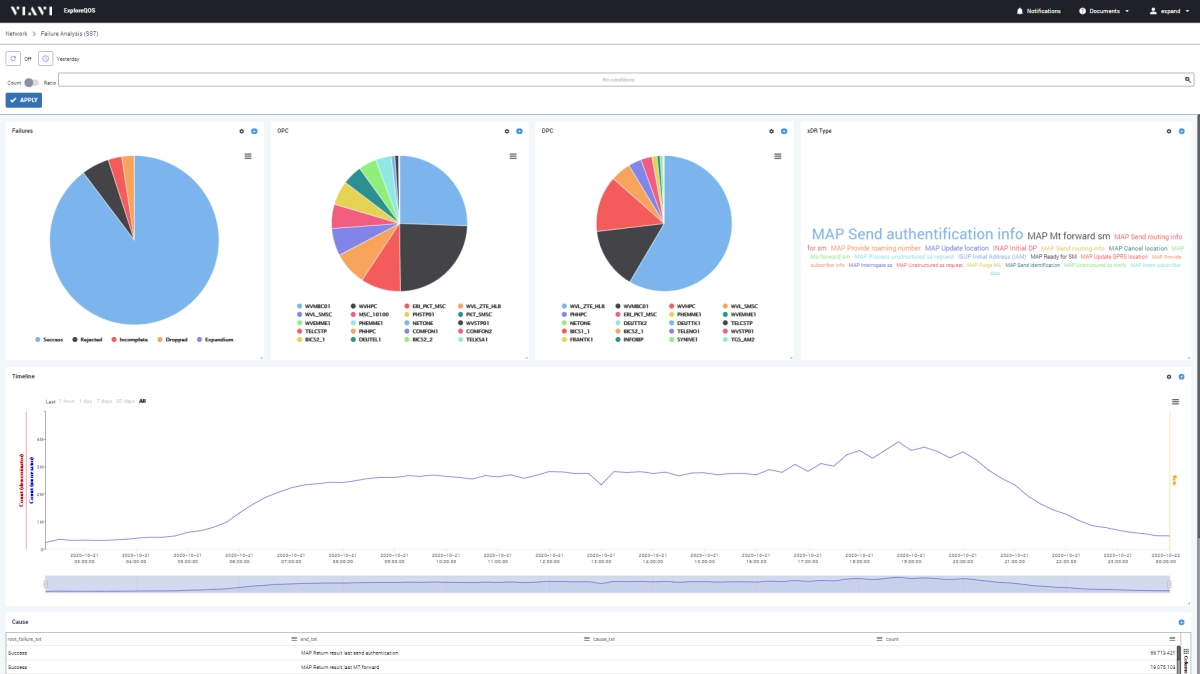
- Failure analysis down to root cause
- Machine learning algorithms
Cells and Network Element Analysis
ExploreQOS aggregates and correlates millions of subscriber-centric data events 24/7 across the entire network. It can quickly assess which of the network elements and/or services are being impacted. From a high-level view of the network performance to detailed KPI trends, users obtain immediate insights into the performance quality of their network and can have a clear picture of the subscribers’ experience across multiple vendor and access technology areas. A complementary set of dashboards is available to the user to investigate deeper issues using different dimensions of the xDRs, for each flow of network traffic: SS7, RAN, Packet Core and Diameter.
Automatic anomaly detection
Network operators tend to visualize every single KPIs to identify an anomaly on its network, through trends or by setting and viewing manually-configured alarms on the system. For most cases, users will be alerted once the issue has occurred, which is already too late.
VIAVI offers solutions to detect automatically when an issue is coming on the network so that user can proactively launch maintenance tasks to fix or repair any dysfunction nodes.
Based on AI (Artificial Intelligence) machine learning algorithm rules, the system learns continuously the KPI values. 2 thresholds (low and high) are defined automatically and continuously by the tool to consider the normal behaviour (confidence interval) for a KPI value at a given time.
When the KPI value crosses the threshold, an abnormal situation is raised.
Device Analysis
ExploreQOS provides a countrywide view of device statistics, with insightful KPIs per device model and vendor all for device monitoring, troubleshooting and/or benchmarking. This allows engineers to isolate problematic device models and individual devices. It can also be used to validate performance per device model when launching new services. ExploreQOS easily lists handsets with poor-quality via its advanced filtering and sorting capabilities while browsing through the KPIs.
ExploreQOS also includes KPI reporting and trending capabilities, browsing from global dashboards to detailed lists of KPIs.
Приложения к руководствам
Поддержка на каждом этапе работы
Мы оказываем техническую поддержку, предоставляем услуги, программы обучения и все необходимые материалы. Наша деятельность направлена на максимальное повышение отдачи от ваших капиталовложений в систему VIAVI.
Позвольте вам помочь
Мы всегда готовы оказать вам всю необходимую помощь.